March – May 2026
What's new in Lighthouse
A lot shipped this season — AI built into every metric, smarter modeling, and the access controls your team has been asking for. Here's everything that's live.
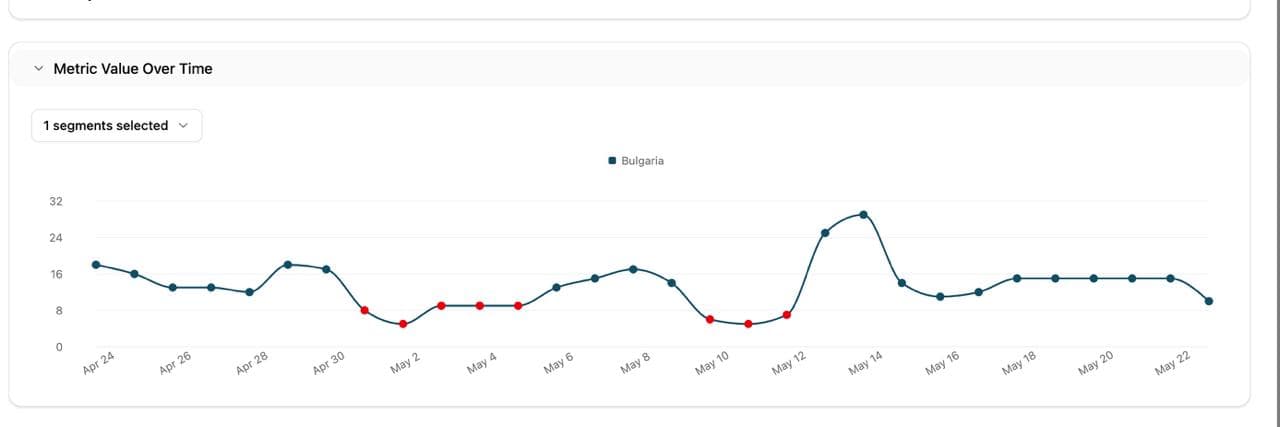
See 30 days of history while you're still building the metric
As you configure a metric, Lighthouse now shows you exactly how it would have behaved over the last 30 days — anomalies, alert triggers, and all. Tune your thresholds and windows before you ever go live, so you know it won't be noisy on day one. One of the most-requested features we've shipped.
Lighthouse now tells you what to fix
Lighthouse analyzes your metrics and surfaces specific improvement suggestions — better windows, missing segments, threshold mismatches. One click to review, one click to implement.
Mixpanel, connected
Connect Mixpanel as a data source in Lighthouse. Query your product events alongside your warehouse metrics — behavioral data and business KPIs in one place.
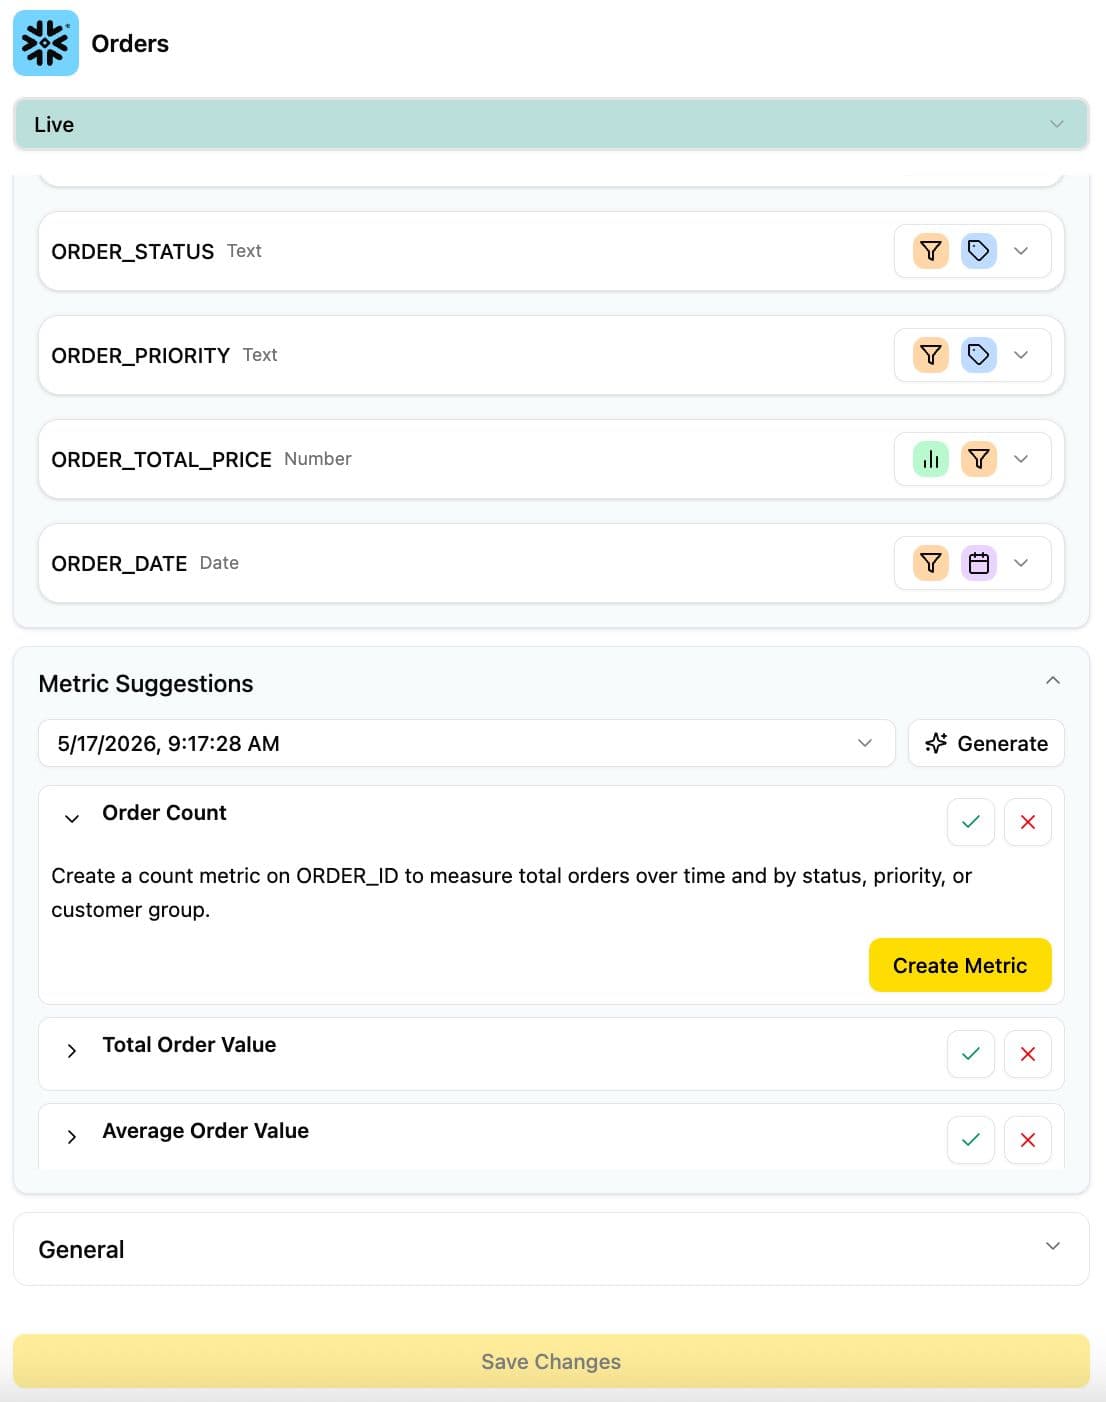
Connect a dataset, get a metric plan
When you create a new dataset, Lighthouse analyzes the schema and recommends which metrics to track — with definitions and config pre-filled. Turn a raw table into a monitoring plan in seconds.
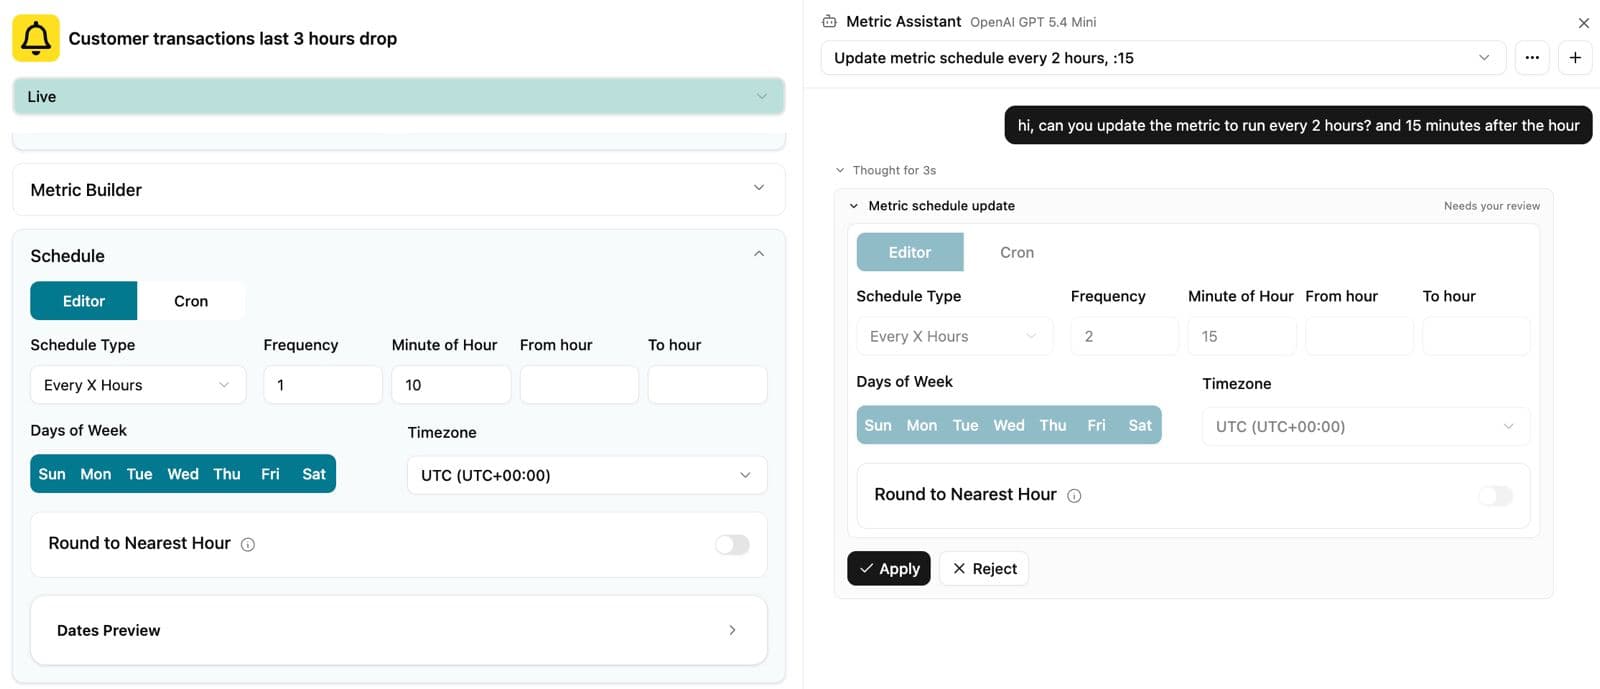
Chat with your metrics — right where they live
An AI assistant is now embedded directly in every metric, data source, and dataset — with multiple threads and full history. Use Ask mode to explore freely, or Agent mode to apply changes. You approve every action before it runs.
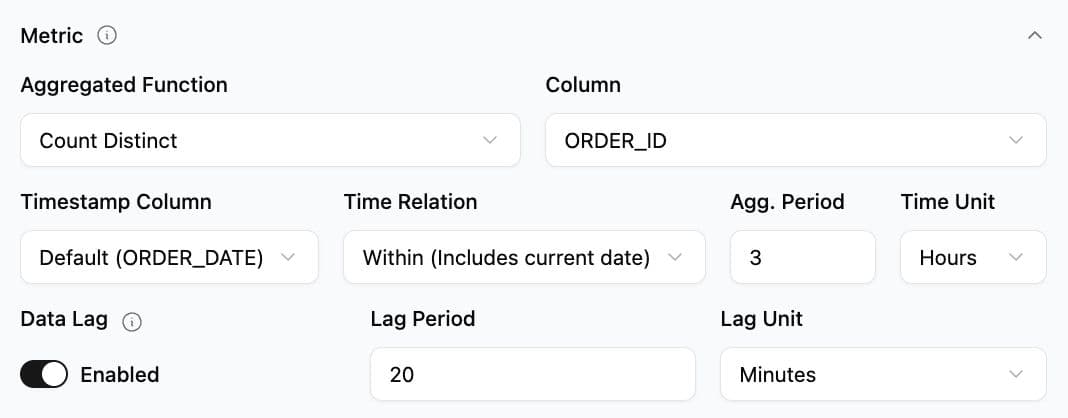
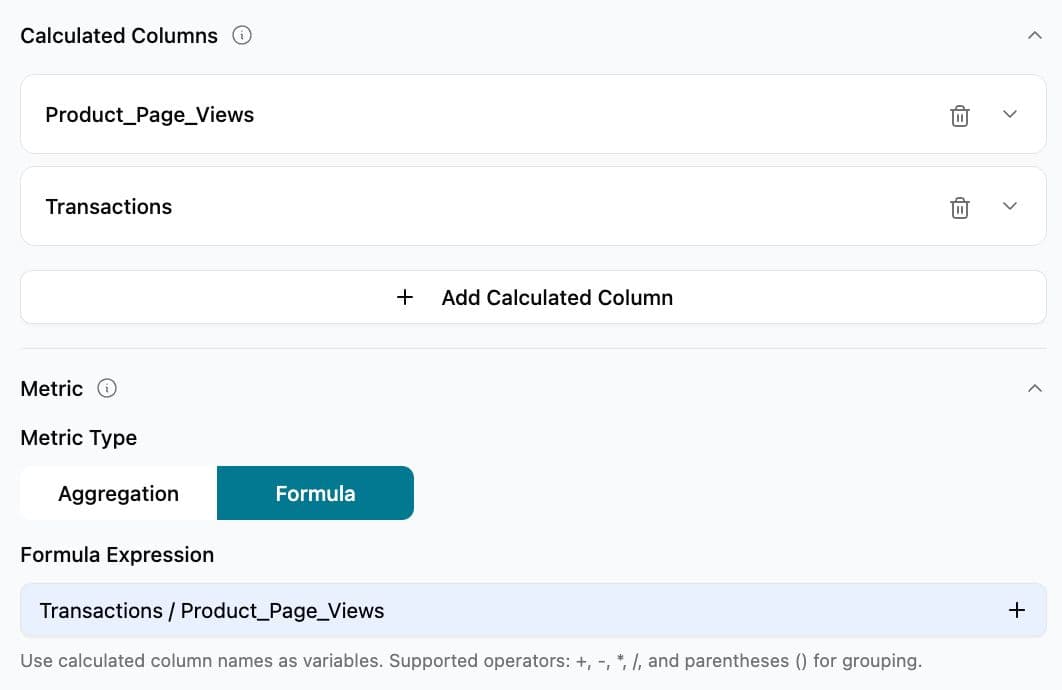
Ratio metrics, data lag, and count distinct
Build composite KPIs like conversion rate directly in Lighthouse. Set a data lag offset so alerts fire against the real “now.” Count distinct works across all warehouses.
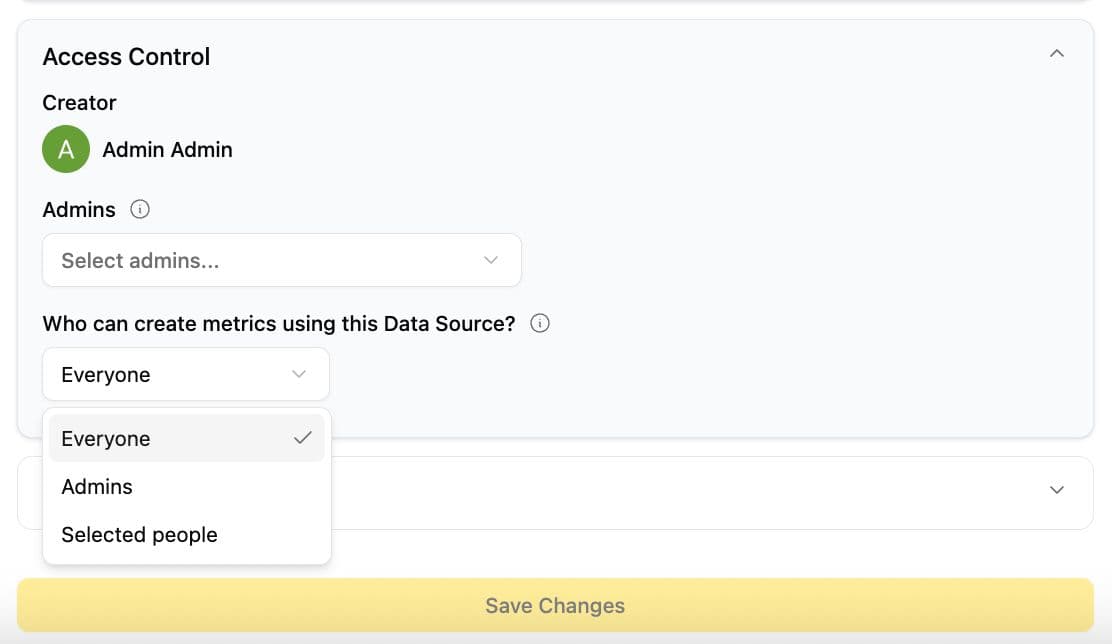
Full ownership control on metrics and data sources
Every metric and data source now has an owner. Non-owners get a full read-only view — explore, query, chat with AI — without being able to change the definition.